BI Helper is a powerful tool that streamlines Power BI report generation and delivery, providing solutions to some of the most common reporting challenges organizations face. Here’s a snapshot of how BI Helper can transform your reporting processes by automating:
This article shows how you can enhance your reporting in the above areas, and how BI Helper ensures that you get the most out of your Power BI reports.
Automating the process of distributing reports is the key to efficient decision-making. Generating and distributing reports manually involves a lot of time-consuming steps - storing data, filtering it and finally formatting it for various stakeholders. Though the process may work at a small scale, it rapidly becomes complex and unmanageable as data volumes and reporting requirements increase.
This is where BI Helper steps in. Designed for Power BI users, BI Helper streamlines report generation and distribution, allowing companies to set up automation for various report types.
Whether your focus is financial health, supply chain efficiency, employee productivity or project updates, BI Helper helps you deliver the insights your teams need — right when they need them.

For any enterprise, monitoring financial health is essential for well-informed decision-making. According to research, 87% of CFOs say that automation is their primary goal to better manage finance operations. Comparative reports of revenues and expenses provide valuable insights. BI Helper enbles you to generate them weekly, monthly, quarterly, yearly or on-demand, based on the metrics and reporting needs of the organization.
Financial reports are critical for C-level executives, finance departments and heads of departments as they provide critical information on the organization's financial status. Automated reports ensure that stakeholders get timely and accurate information without having to go through the laborious exercise of fetching and processing reports themselves.
For the reports to be meaningful, they must cover key metrics like total revenue, operational expenses, profit margins, cost per department and budget adherence. BI Helper enables you to filter and organize data to suit each stakeholder’s focus, eliminating unnecessary data and emphasizing what’s most relevant. Setting up automated distribution can help finance teams keep executives and board members well-informed, freeing up time for deeper financial analysis and strategy planning.

Supply chain and inventory reports are invaluable for managing resource availability and preventing shortages. A 2024 benchmark report highlights that 72% of small and medium businesses (SMBs) encounter issues with supplier reliability, which can lead to inventory gaps.
Whether you’re monitoring stock levels or analyzing supplier performance, BI Helper can support these tasks by scheduling regular custom reports in Power BI. Key recipients include inventory managers, procurement officers and logistics teams. Having reports automatically generated and shared ensures that these teams are always working with the latest information, which is crucial for effective supply chain management.
For supply chain and inventory reports, the focus is on inventory turnover rates, order fulfillment timelines, stockout incidents, supplier reliability and delivery accuracy.
BI Helper allows you to adjust filters according to each department’s needs, so procurement can focus on supplier performance while logistics teams track order fulfillment and delivery. The regular flow of this data helps prevent costly supply chain issues and equips teams to respond swiftly to market demands.

Monitoring employee productivity provides insights into team efficiency and workload distribution, enabling HR and line managers to address productivity bottlenecks. Employee productivity reports can encompass metrics on attendance, task completion, project contributions and hours logged.
These reports are highly relevant for HR departments, team leads and department managers who need to track and manage employee productivity and efficiency. By understanding these metrics, HR teams can identify top-performing employees, flag potential burnout and structure reward programs.
Productivity insights include task completion rates, average hours worked, project contributions and efficiency scores. BI Helper’s automation and filtering capabilities ensure these metrics are consistently distributed to the appropriate departments, allowing managers to track progress without manual input.

Project status reports keep stakeholders in sync with a project's progress, outlining completed tasks, pending items, spending and timelines. Automating them through BI Helper provides timely updates to project managers, team members and clients. Building a common understanding helps manage expectations and ensure good outcomes on project delivery, leading to enhanced customer satisfaction.
Project reports include metrics like the percentage of tasks completed, budget spent, upcoming deadlines and any roadblocks. BI Helper’s filtering options allow you to segment data for different audiences. For example, team members might see a detailed task breakdown, while clients receive a broader summary focused on milestones and timelines. Automating project updates helps streamline communications, reduce meeting time and ensure accountability across teams.
Integrating BI Helper with Power BI can help organizations significantly cut down on time spent generating and distributing reports. The freedom granted by automated reporting allows businesses to tailor their data sharing for different internal and external stakeholders so that everyone receives exactly what they need.
Whether tracking finance and managing inventory, ascertaining the productivity of employees or giving insights into project progress, BI Helper is an indispensable tool for data-driven decision-making.
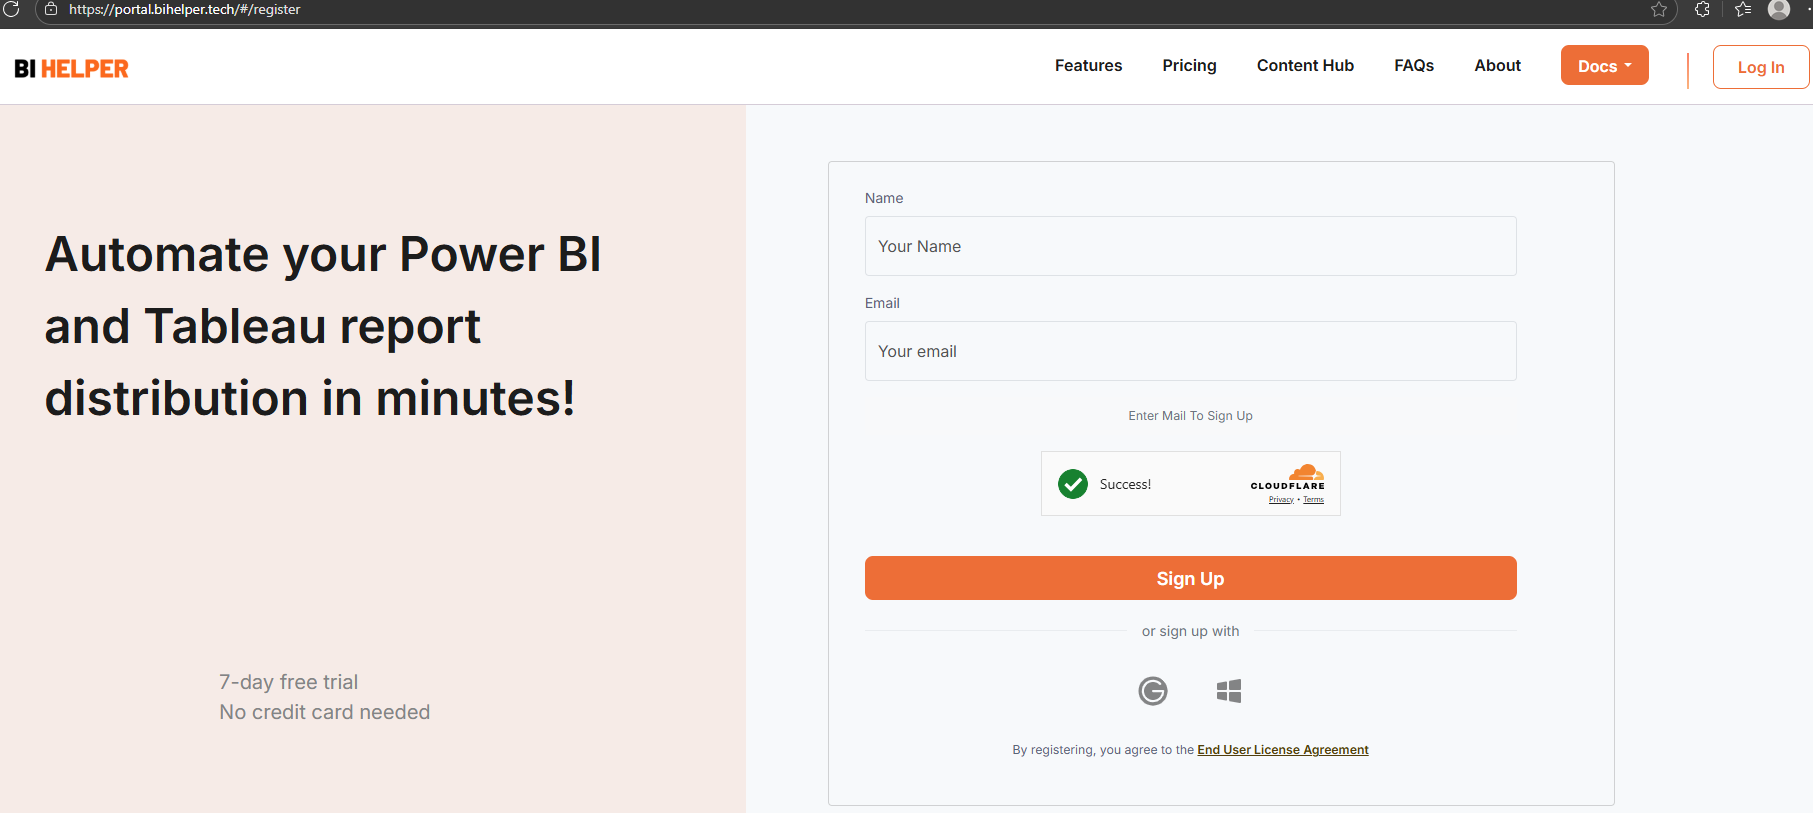
Ready to streamline your reporting workflow and spend more time understanding the insights of data distribution? Explore our pricing options today and see how BI Helper can transform your Power BI reporting experience!