BI Helper is a SaaS application that automates the creation and distribution of PDF/ PPTX reports from Power BI. It enables businesses to apply filters and slicers to their Power BI reports, generate user-specific PDF/ PPTX files and share them with customers, vendors and employees.
To use BI Helper, an organization needs to buy just one Power BI Pro/ PPU license from Microsoft. No investment is needed in servers, storage or any other IT infrastructure.
Along with PDF/ PPTX, BI Helper can export filtered/ sliced (user-specific) table and matrix visuals in Power BI to Excel. These files can be emailed to recipients on a defined schedule or on demand. This tutorial explains how to use BI Helper to automate the export of table and matrix visuals to Excel. The detailed steps are given below.
1. Create your BI Helper account at Sign Up.
2. Once you sign in, BI Helper takes you to the Job Summary tab. Click on Add New Job + to set up your Power BI report on BI Helper.

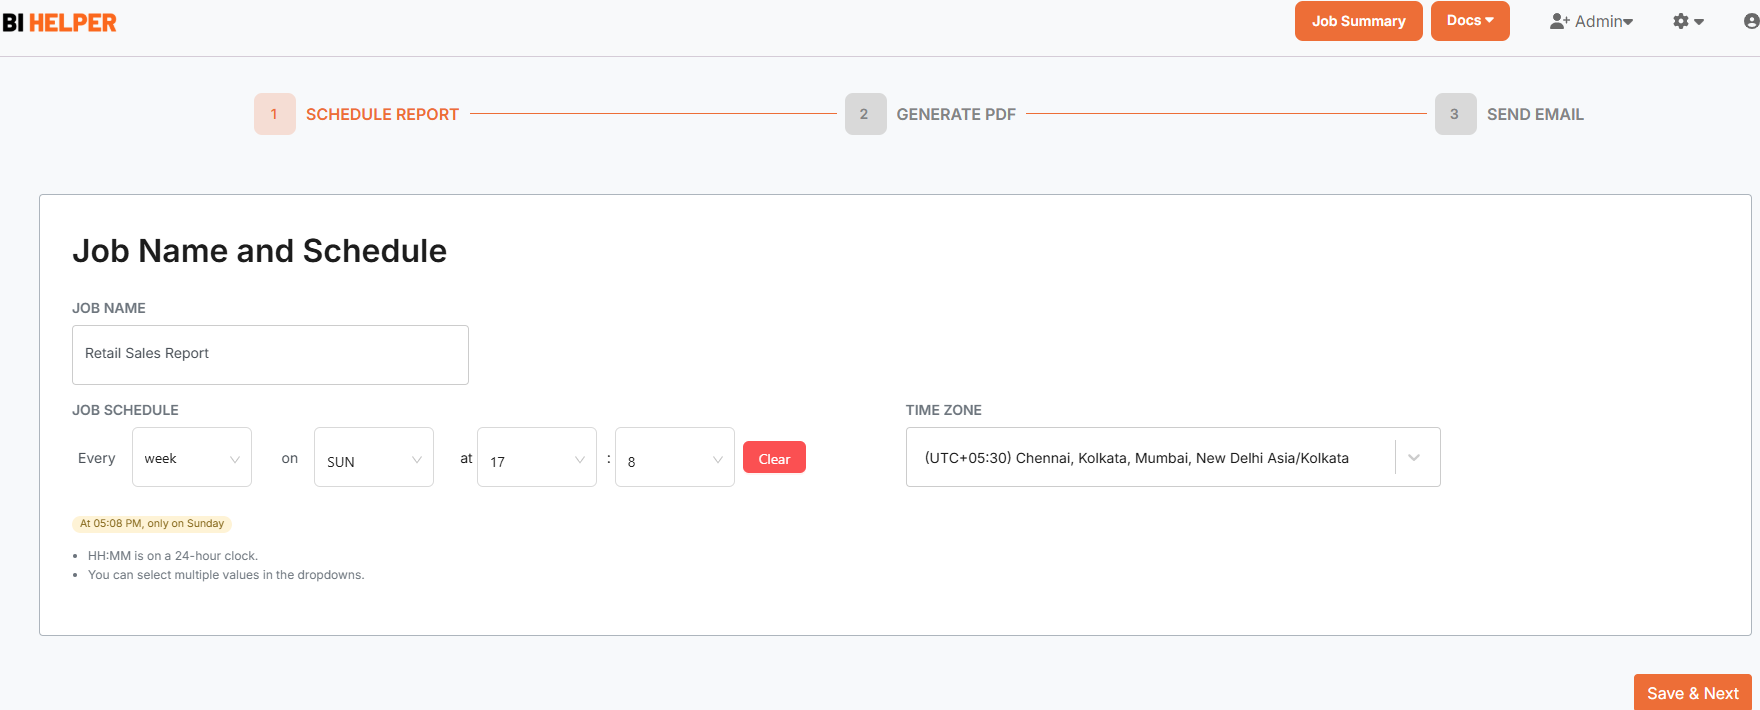
3. This takes you to the Schedule Report tab, where you enter the job name and schedule. Save and go to the Generate PDF tab.
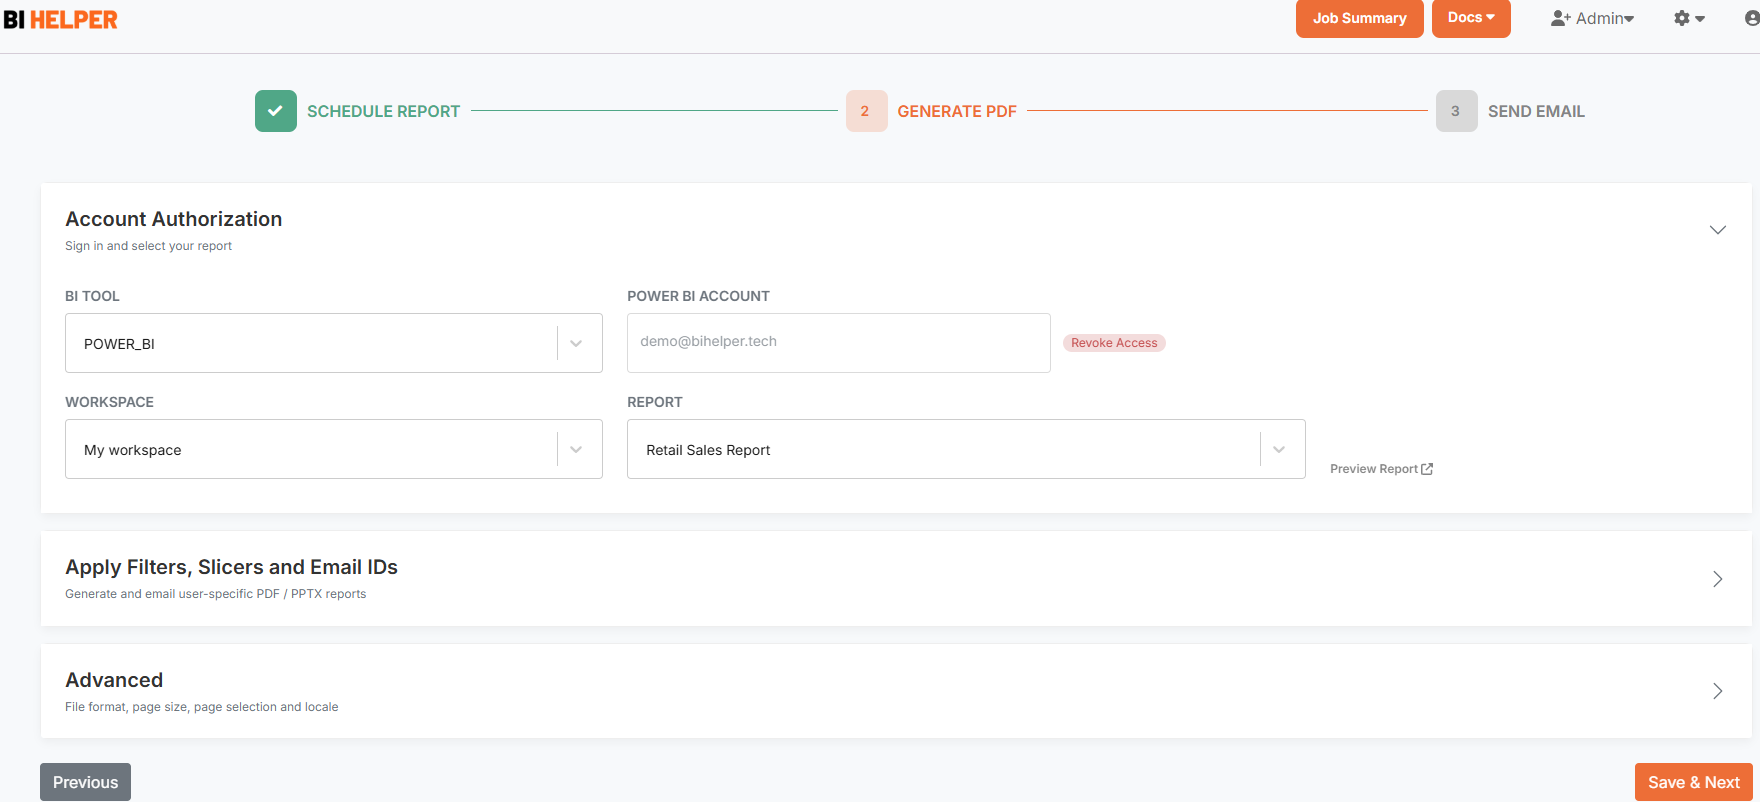
4. The Generate PDF tab has three sections. In the Account Authorization section, sign in to your Power BI account with your Microsoft credentials and select the workspace and report that you want to set up as a BI Helper job. Click on Preview Report to confirm that it opens in BI Helper.
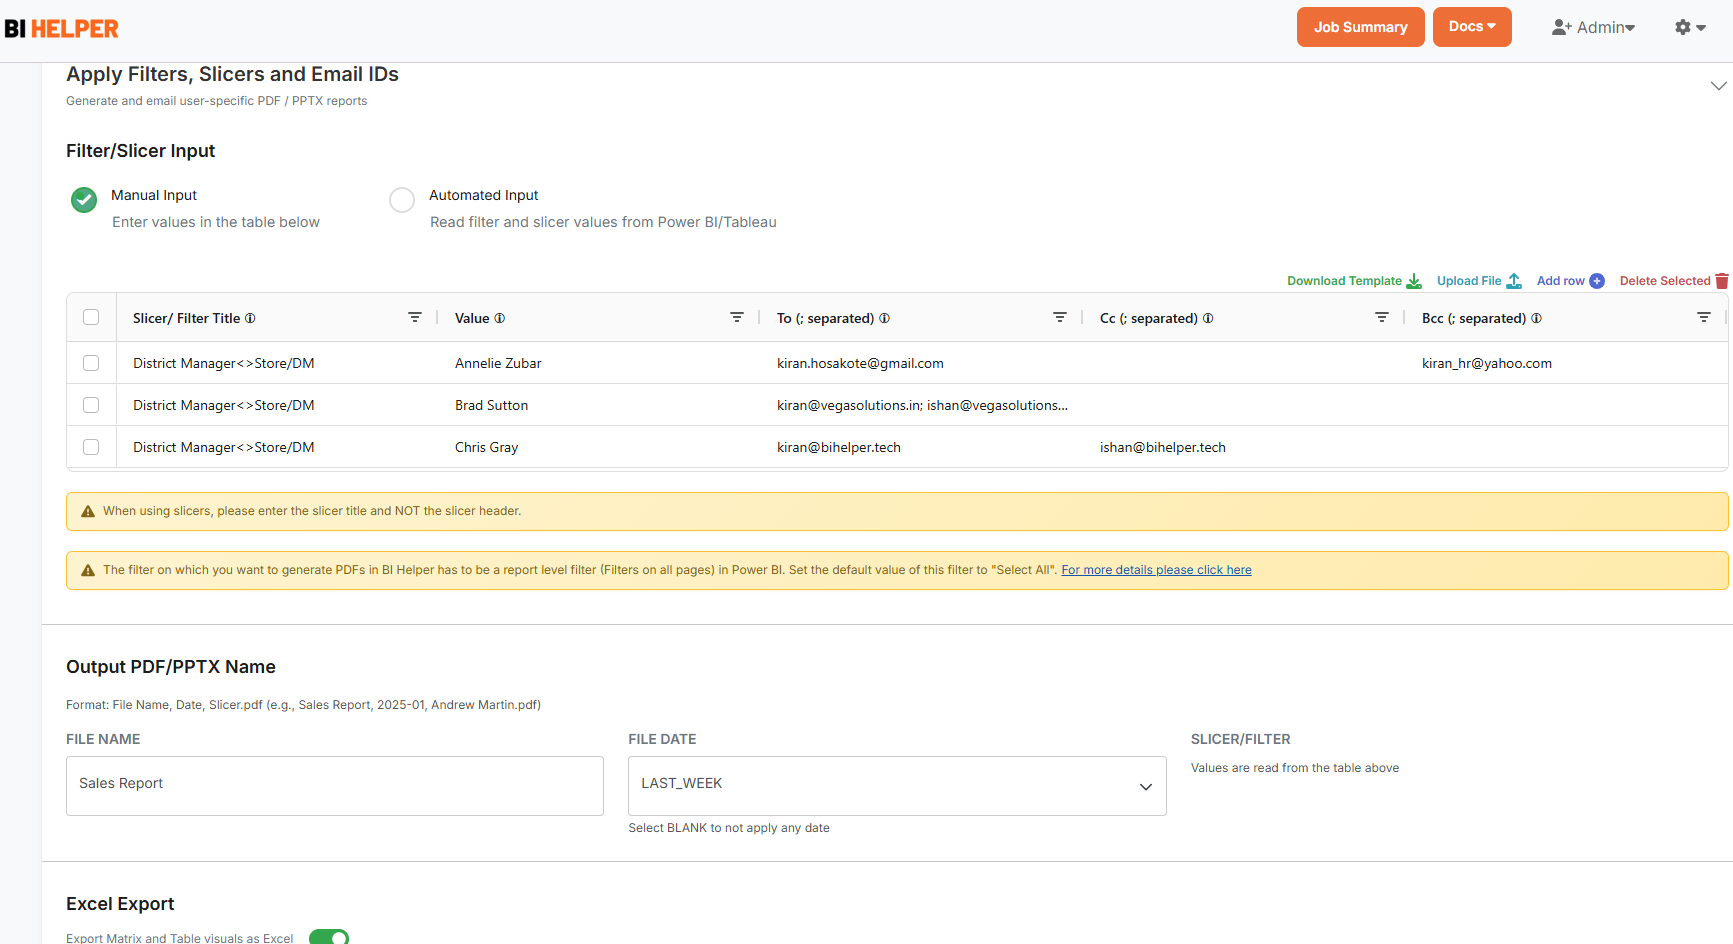
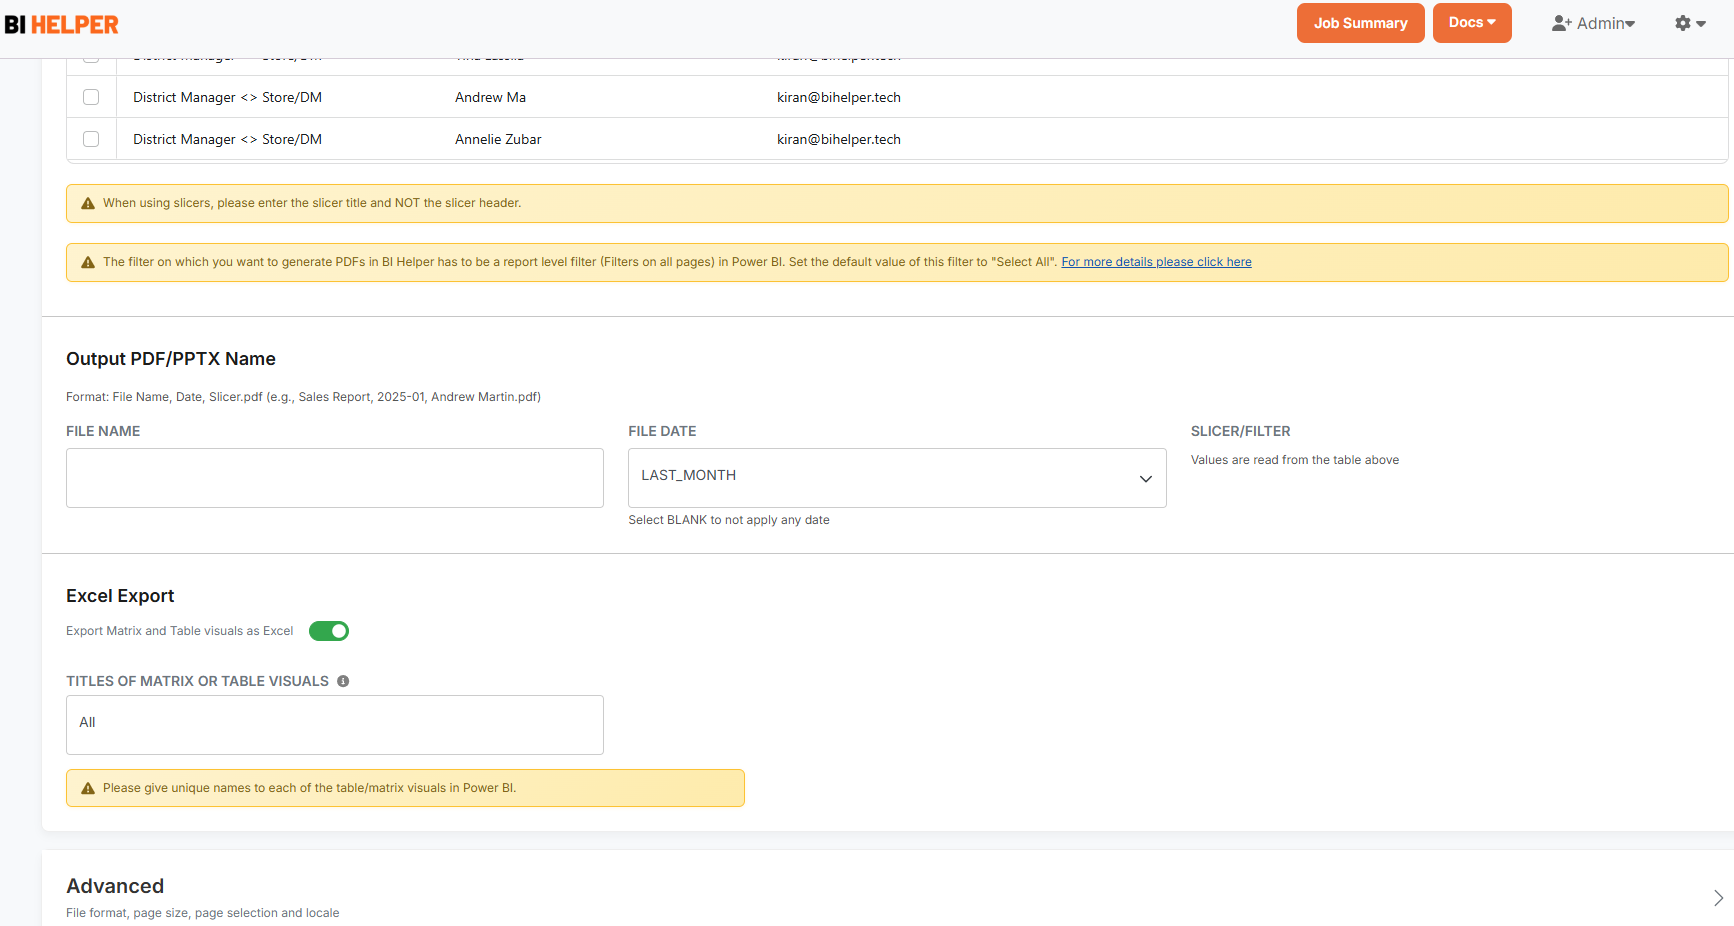
Next, go to the Apply Slicers, Filters and Email IDs section. Depending on the input mode you select, refer to Manual Input or Automated Input to enter the values for filters, slicers and email IDs. Then enter the output PDF/ PPTX filename.
In the Excel Export section, switch the toggle button ON (green). Then enter the Titles of the table and matrix visuals in Power BI which you want to export to Excel.
To export all the table and matrix visuals in your report to Excel, enter the default value All in the box.
To export a selected set of tables / matrixes from Power BI, enter their titles in the box separated by commas (,). For example: Sales Summary, Branch Details
IMPORTANT: Please make sure that your table and matrix visuals in Power BI have unique names, whether they are on a single page of your Power BI report or across multiple pages.
Finally, go to the Advanced section of the Generate PDF tab to set up the output file format (PDF/ PPTX), page size and pages to print. Save and go to the Send Email tab.
5. In the Send Email tab, set up and validate your sender mail ID and type in the email subject and body. Click on Finish to complete your job setup and return to the Job Summary tab.
6. In the Job Summary tab, click on the Play button to run your BI Helper job. Excel files of your selected table and matrix visuals along with a PDF/ PPTX of your Power BI report will be emailed to the defined end-users. The PDF/ PPTX and Excel files are sliced and filtered on the applied values, specific to the users who receive them.
Note: Power BI has an Export > Analyze in Excel feature which lets users connect Excel to a Power BI semantic model (dataset), so they can query and manipulate live data using PivotTables, slicers and formulas. This feature requires users with a Power BI Pro (or higher) license to be logged into Power BI Service while accessing and analyzing their data in Excel. It does not give filtered (user-specific) and ready-to-use Excel output, nor can it be distributed via email or any other means.