How do I generate filtered, user-specific reports in Power BI and share them with my end-users?
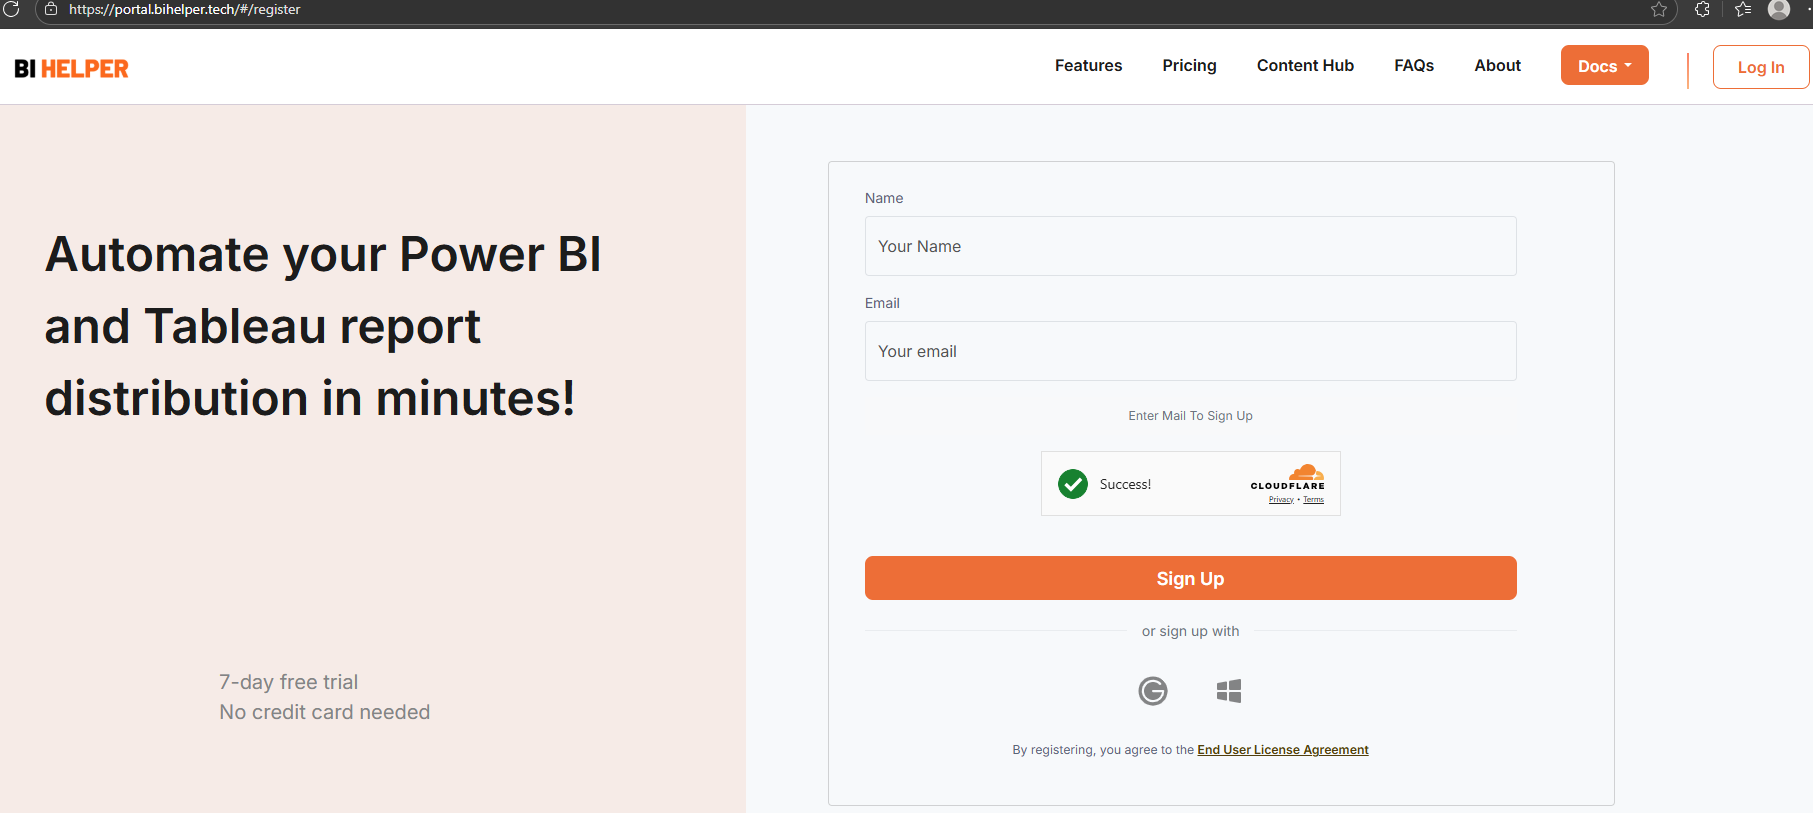
Create a BI Helper account and connect to Power BI Service. Select your Power BI report and set it up as a BI Helper job. Enter the filter/ slicer values and email IDs in BI Helper to create user-specific PDF/ PPTX reports, then email them to the defined end-users.
How do I enter filter/ slicer values and email IDs in BI Helper? Is it a manual process or can it be fully automated?
BI Helper supports both manual and automated input of filter/ slicer values and email IDs. This tutorial covers the manual input process, which is suitable for reports with low PDF/ PPTX volumes. For large volume reports, see Automated Filter and Slicer Input.
Manual filter and slicer input is included in the BI Helper Standard plan starting at $50 per month. It is a robust and cost-effective method to generate and distribute Power BI reports, delivering large productivity gains to business intelligence teams.
This tutorial explains how to manually apply filters and slicers in BI Helper and email the PDF/ PPTX output files to selected end-users. The detailed steps are as follows:
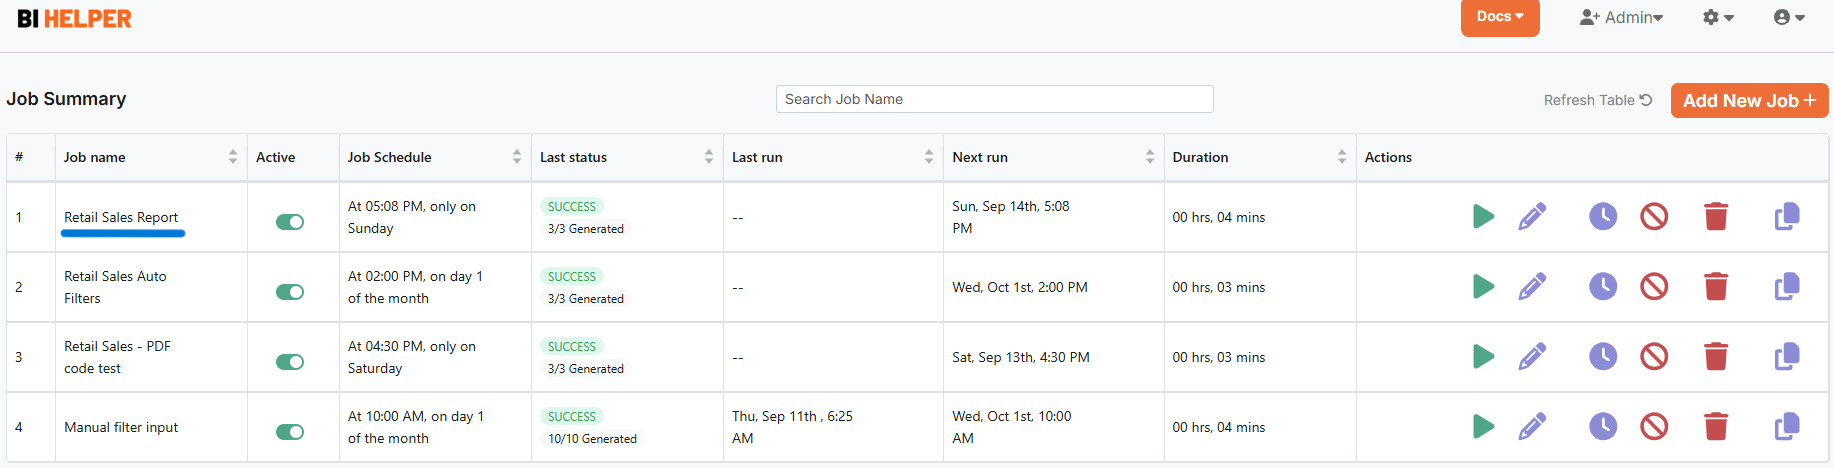
2. Once you sign in, BI Helper takes you to the Job Summary tab where you see the Retail Sales Report. This Power BI report is the default BI Helper demo job. Click on the Edit Job icon (blue pen).
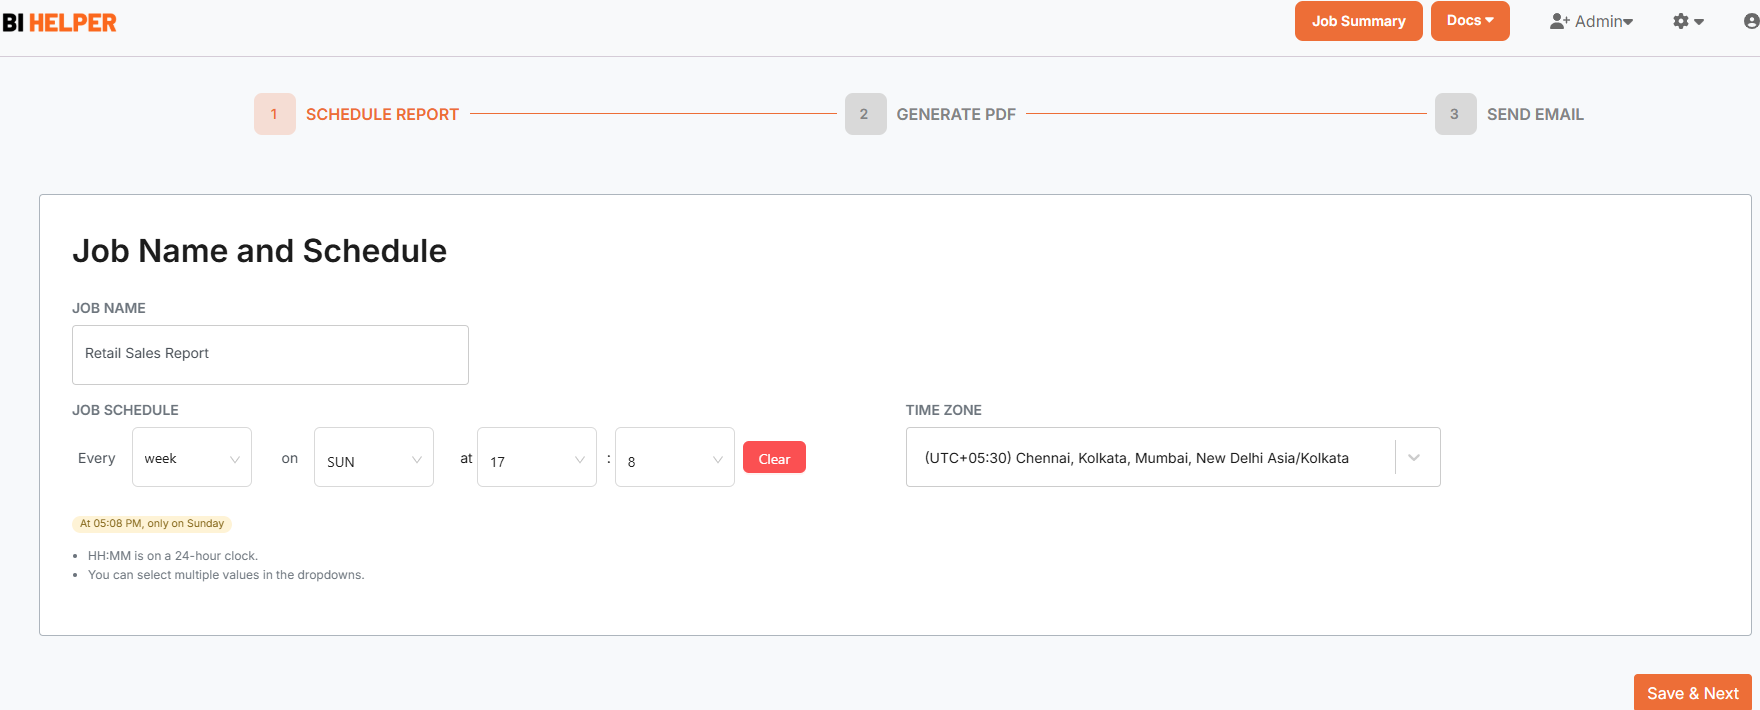
3. This takes you to the Schedule Report tab. Verify that the job name is Retail Sales Report. Save and go to the Generate PDF tab.
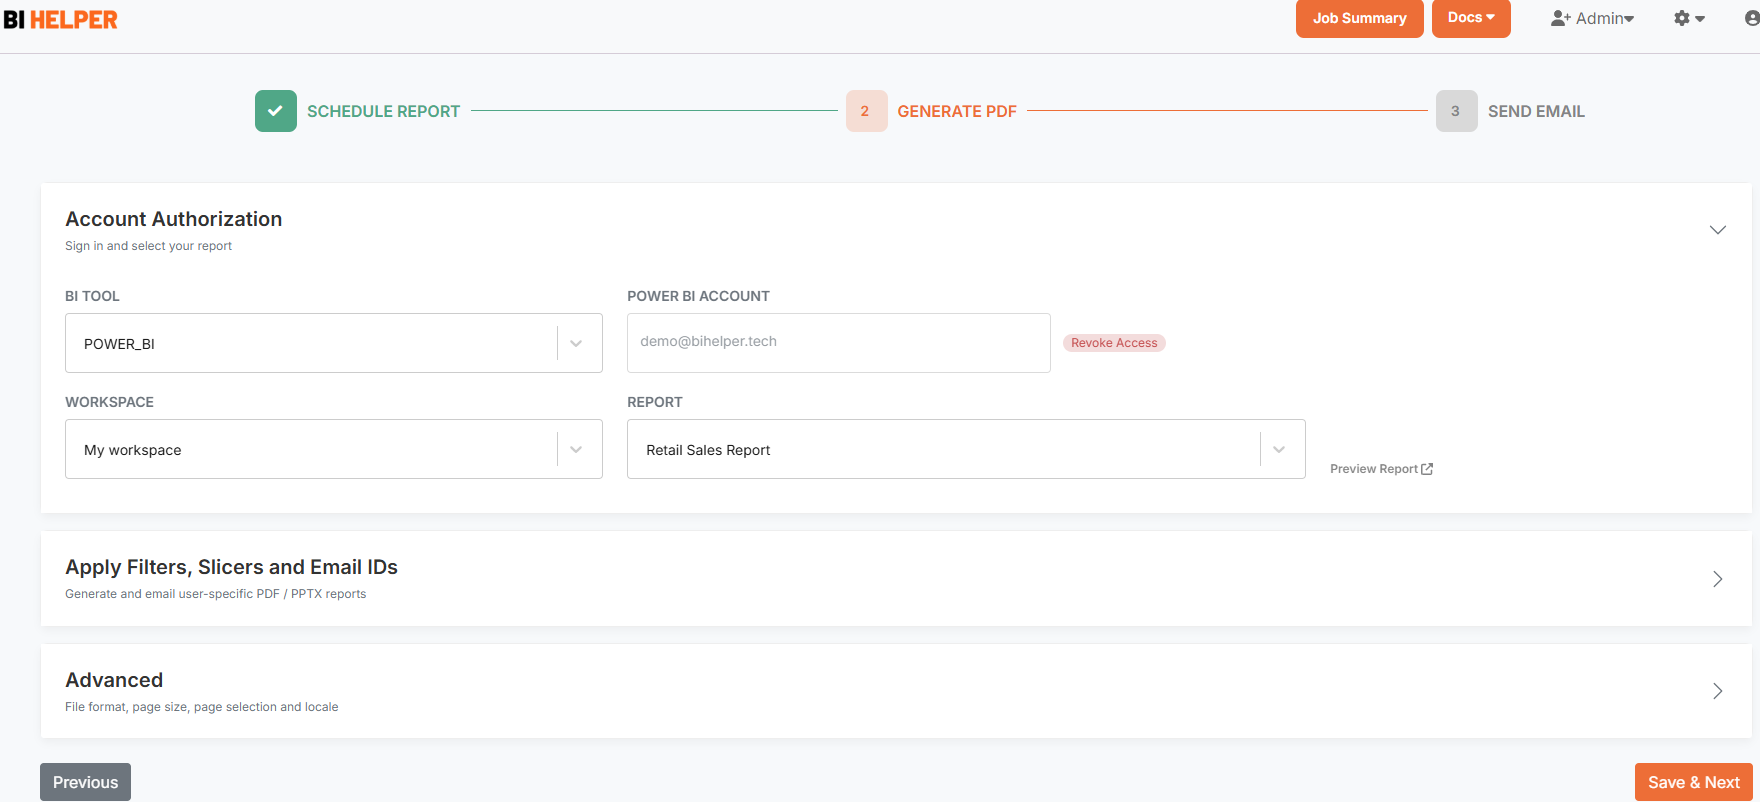
4. The Generate PDF tab has three sections. In the Account Authorization section, sign in to your Power BI account with your Microsoft credentials and select the Retail Sales Report. Click on Preview Report to confirm that the Retail Sales Report opens in BI Helper.
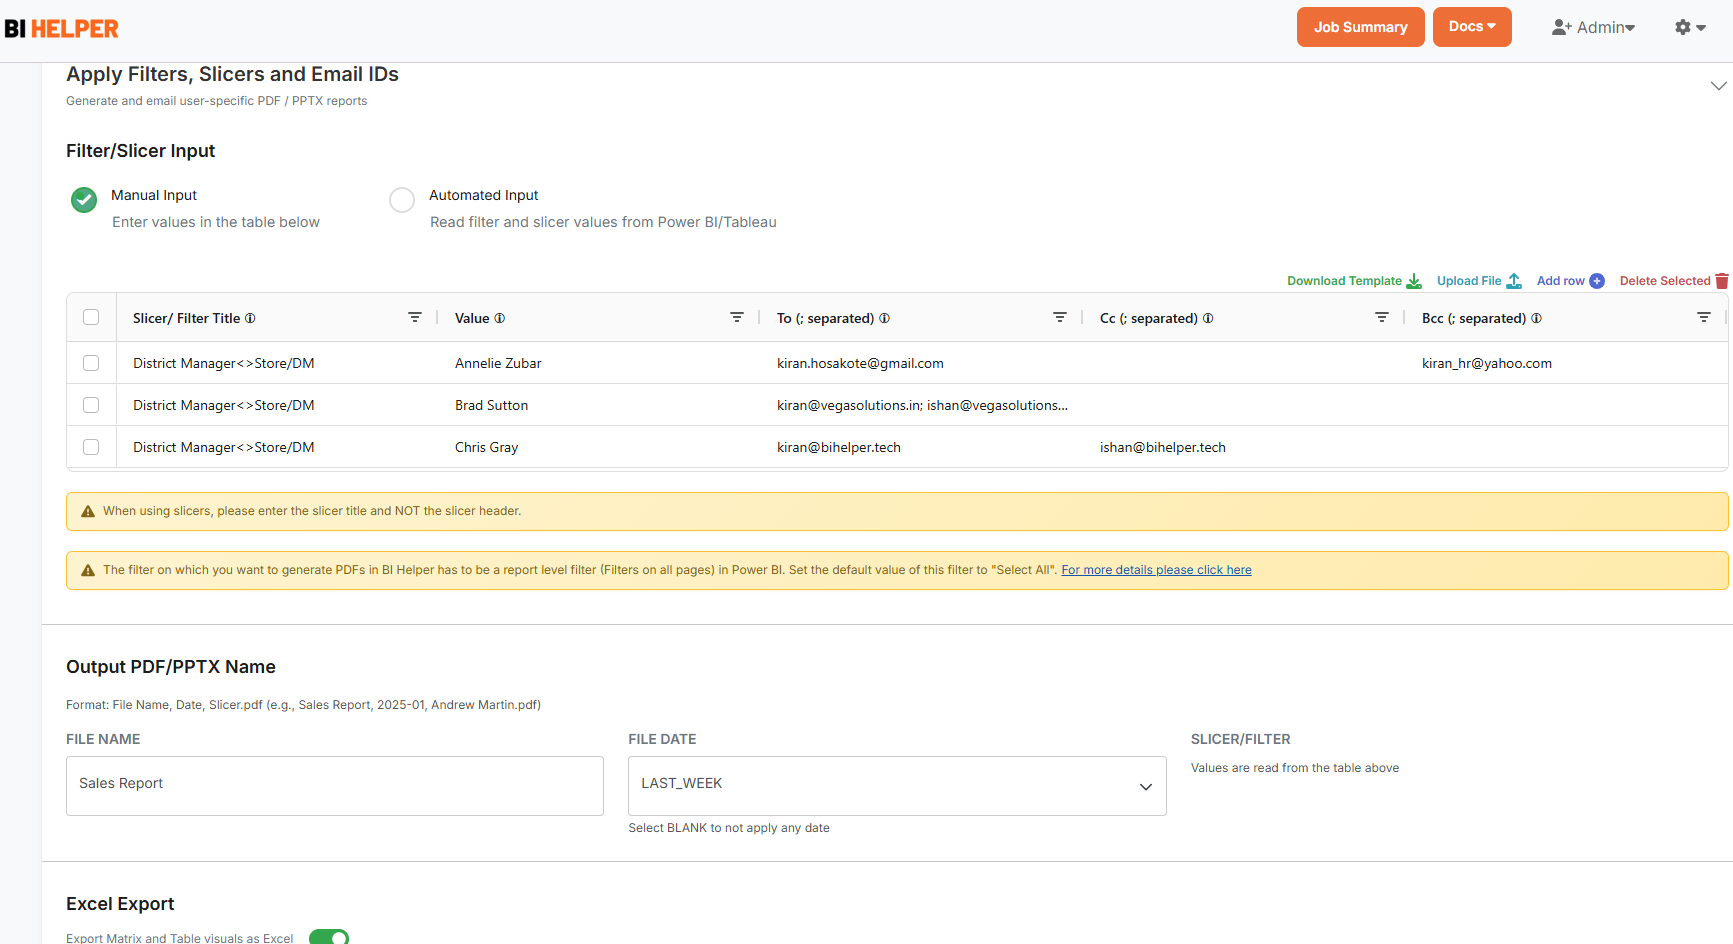
Next, go to the Apply Slicers, Filters and Email IDs section. Select the Manual Input mode. Enter the slicer / filter values and recipient email IDs in the input table based on the below instructions for:
A. Slicer Configuration
B. Filter Configuration
Or download the Excel template at the top right of the input table, enter the values and upload the file.
If you don't want to apply filters or slicers, leave the Slicer/ Filter Title and Value columns blank.
Finally, enter the output PDF/ PPTX filename and the titles of the table and matrix visuals in your Power BI report which you want to export to Excel.
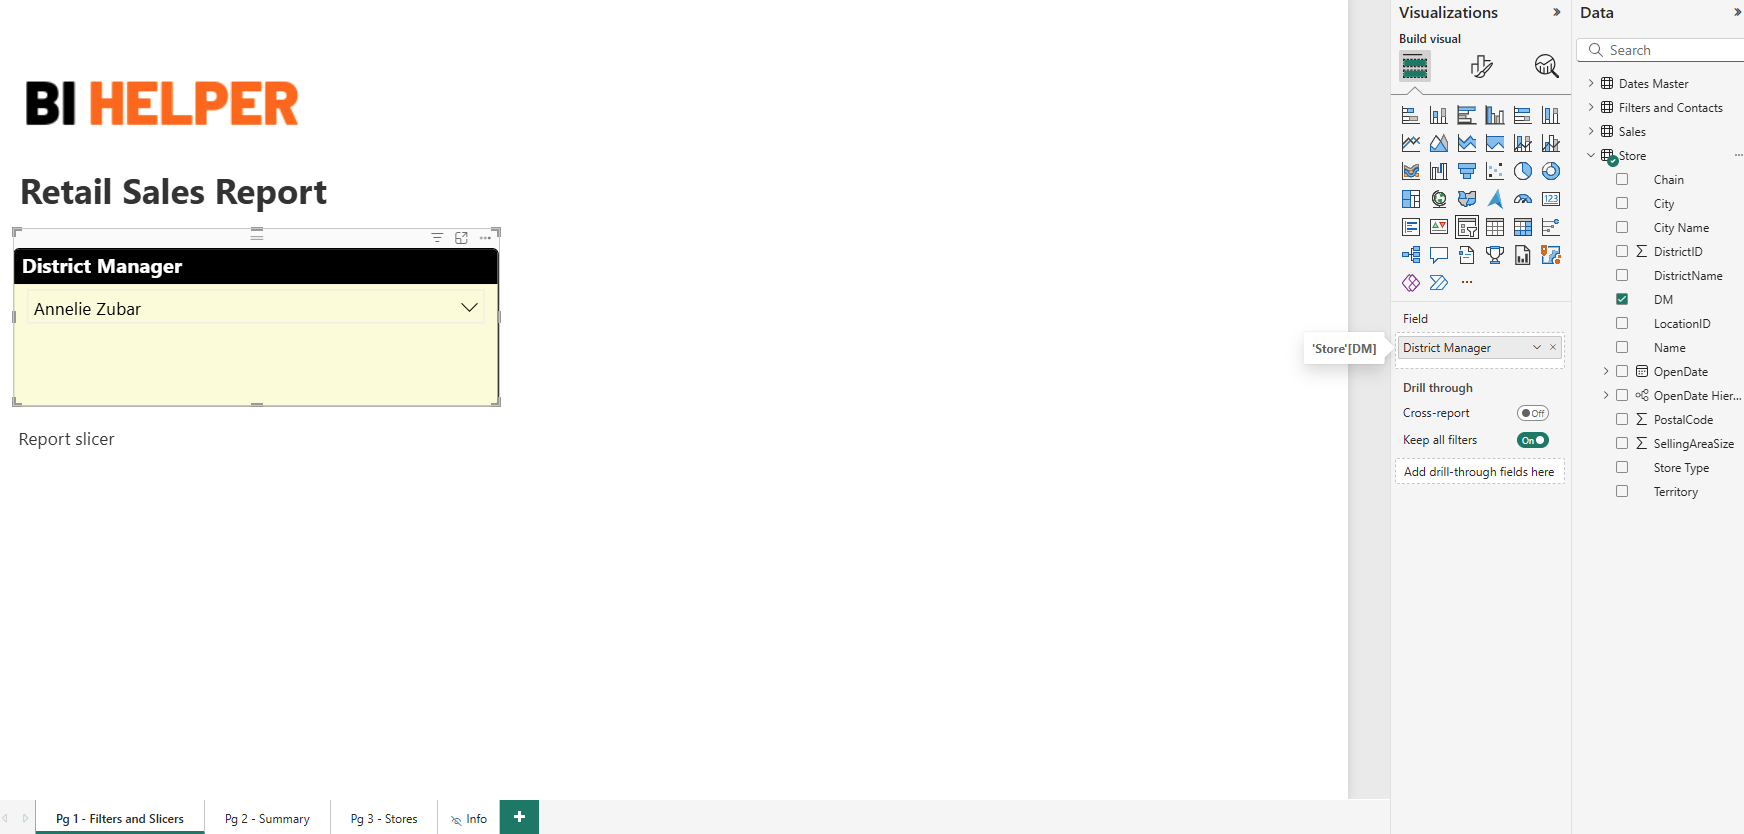
BI Helper reads slicers from the first page of a Power BI report. Slicers in BI Helper follow the syntax: Slicer Title<>Table Name/Column Name.
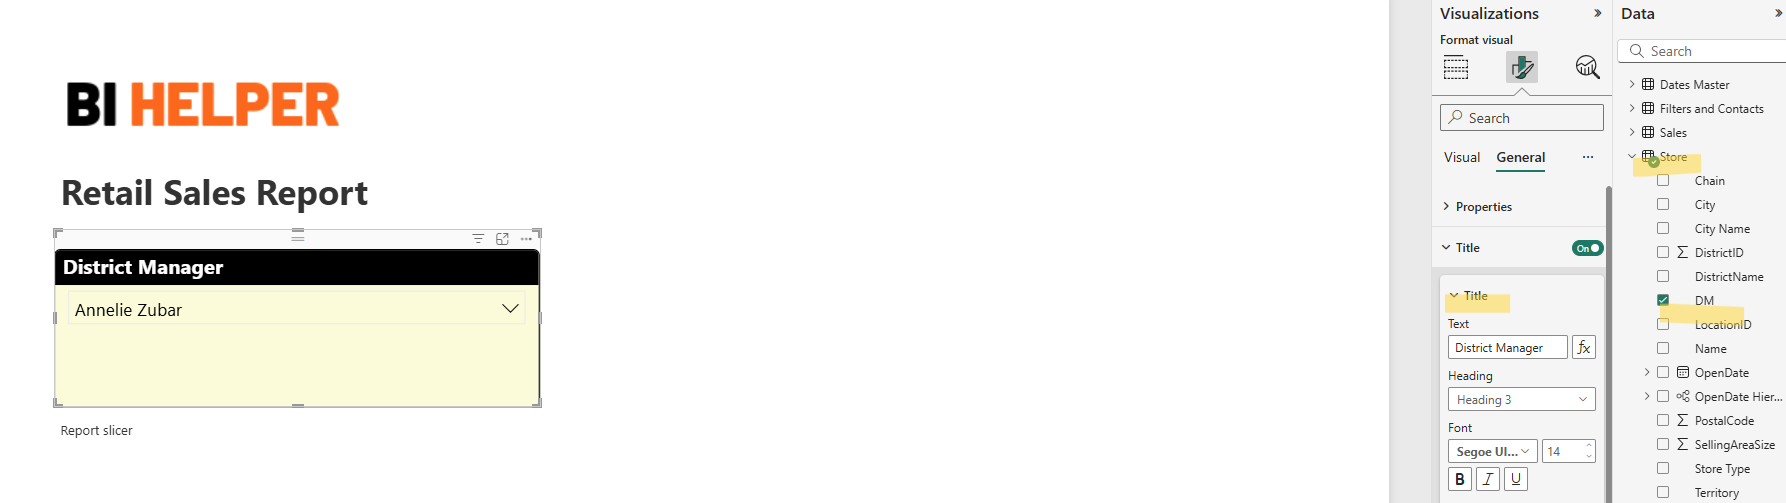
BI Helper identifies slicers using the Title field in Visualizations > General in Power BI. It does not read the slicer Header.
1. In the Retail Sales Report, the District Manager slicer uses the DM column in the Store table in Power BI. In the BI Helper input table, enter the slicer as District Manager<>Store/DM as seen in the visual above. The slicer values in the second column are the names of the District Managers - Annelie Zubar, Brad Sutton and Chris Gray.
Important: Slicer title, table name, column name and slicer values are all case-sensitive and have to be entered exactly as they are in the Power BI report.
2. Numeric Slicers: Use the int(12345) format to enter values of numeric slicers in the second column of the input table.
Date Slicers: BI Helper supports ‘Between’ date slicers. Enter date slicer values as StartDate::EndDate in the ISO 8601 format, e.g., 2021-03-01T00:00:00::2021-03-31T00:00:00.
3. Multiple slicers are separated using the pipe operator |. Say you have a second slicer Product<>Item Master/Product Name, and one of the products is T-Shirt 38045.
To apply both slicers, enter the Slicer/ Filter Title in the input table as: District Manager<>Store/DM | Product<>Item Master/Product Name
Enter the Value in the second column as: Annelie Zubar | T-Shirt 38045
4. Enter the recipient email IDs in the To, Cc and Bcc columns. Multiple email IDs in a column need to be separated by a semicolon (;).
5. Add a new row in the input table for each slicer combination and set of email recipients.
For automated slicer / filter and email input, see this tutorial.
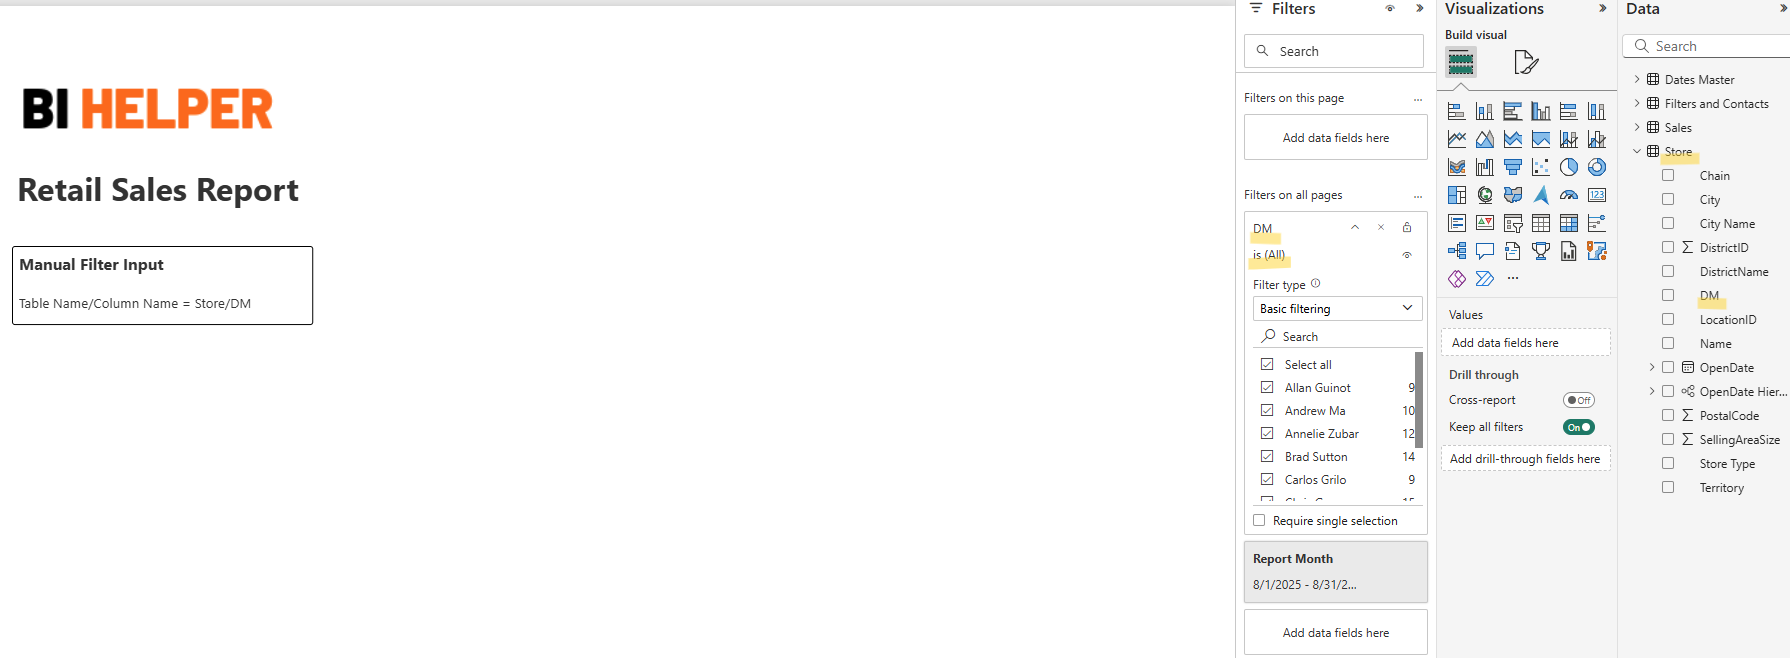
BI Helper supports report level filters (go to Filters pane > Filters on all pages) in Power BI. It does not support page filters or filters applied to individual visuals.
The steps to configure filters in BI Helper are the same as for slicers, except for the way filter names are defined.
1. Filters in BI Helper follow the syntax: Table Name/Column Name. In the visual below, the report level filter (filters on all pages) is DM, which is a column in the Store table. In the BI Helper input table, enter the filter title as Store/DM in each row. The filter values in the second column are the names of the District Managers - Annelie Zubar, Brad Sutton and Chris Gray.
Important: Table name, column name and filter values are all case-sensitive and need to be entered exactly as they are in Power BI.
Values of numeric and date filters follow the same format as numeric and date slicers respectively.
2. To use both slicers and filters as inputs to BI Helper, please separate them using the pipe operator | as detailed in the slicer configuration section.
1. After entering slicer/ filter titles and values, and To, Cc and Bcc in the email recipient columns, save and go to the Send Email tab.
2. Enter and validate your sender mail ID. To ensure that your emails are delivered without being marked as spam, please make your sender email DMARC compliant. Go to Docs > Email Authentication for an overview of the process.
3. Enter the email subject and body.
4. Click on Finish to complete your job setup and return to the Job Summary tab.
In the Job Summary tab, click on the Play button to run the Retail Sales Report. BI Helper will apply the slicer, filter and email values entered in the above steps to create and send PDF/ PPTX reports to your end-users.