Data drives decisions. But how often do we become overwhelmed by repetitive operations such as filtering datasets, building customized views, and manually preparing reports?
McKinsey found that employees spend roughly 25% of their workweek on mundane chores, emphasizing the need for automation. The automated filtering feature in BI Helper is designed to address these inefficiencies, freeing up your time to focus on what is important - analyzing and acting on insights.
In this article, we will look at how automated filtering works, why it is simple to set up, and how it will transform your team's approach to reporting. Whether you are a first-time user or want to improve your BI Helper experience, this post provides practical insights for you.
Table of Contents
- What Is Automated Filtering in BI Helper?
- How Hard Is It to Set Up?
- Use Cases for Automated Filtering
- How Does This Benefit Me and My Team?
- How Can This Benefit My Company?
- Maximize the Value of Automated Filtering
- Ready to Get Started?
What Is Automated Filtering in BI Helper?
Automated filtering is a powerful feature that enables users to dynamically adjust data views within their Power BI reports without manual intervention. This means you can automate the generation of customized reports for different end-users, ensuring that everyone gets the specific insights they need, right when they need them.
In simple terms, automated filtering eliminates the repetitive task of manually setting up filters and slicers in Power BI for each report recipient. Whether it’s slicing data by region, department, or any other criteria, BI Helper takes care of it seamlessly.
With this feature, organizations can deliver targeted insights to report users while greatly reducing the time spent on creating reports, thereby freeing up their time to focus on interpreting data and making informed decisions.
How Hard Is It to Set Up?
Setting up automated filtering does not require any technical expertise. BI Helper’s intuitive interface makes it easy for business users (read: non-technical users 🙂) to configure filters and slicers in their Power BI reports.
Here’s a quick overview of the setup process:
- Define Your Filters and Slicers: Choose the criteria that need to be applied, such as period, geographic region, or product category. Filters allow you to narrow down large datasets into actionable insights tailored to specific needs. Examples include filtering sales data by quarter or customer feedback by product category.
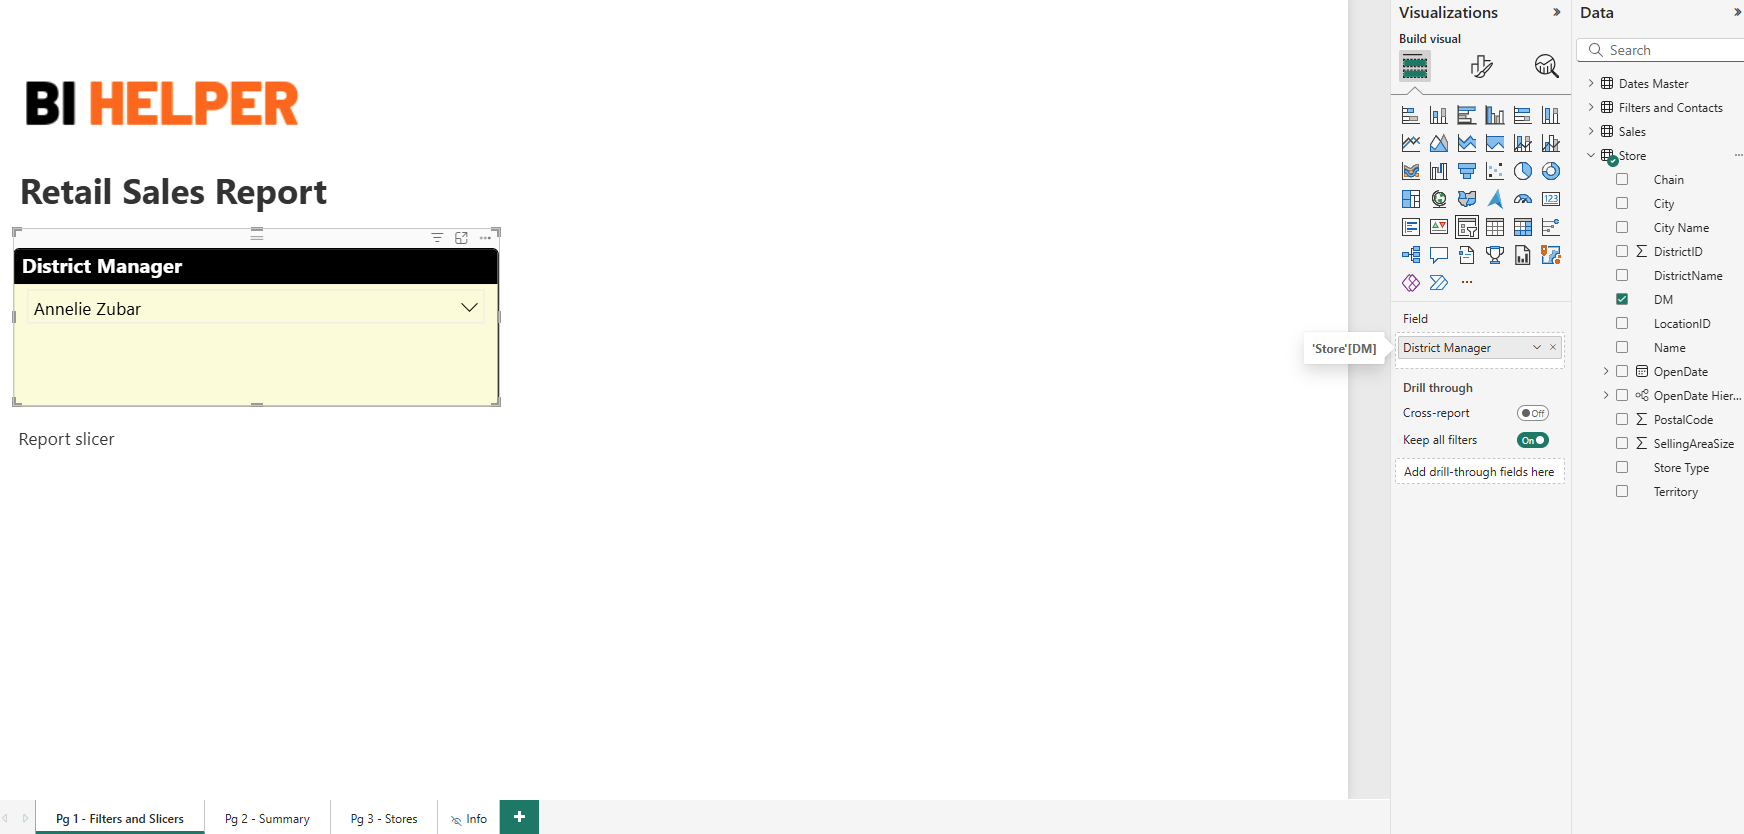
- Configure Slicers: Our step-by-step guide Configure a Report with Slicers and Filters walks you through the entire process of applying filters and slicers in BI Helper, which only needs to be updated for every report run. To automate this even further, see #4 below.
- Automate Report Generation: Use the automation settings to schedule and deliver customized reports. Reports can be scheduled daily, weekly, monthly, or at any desired cadence.
- Dynamic Filter and Slicer Selection: This is a great feature that reads the latest filter / slicer values and email IDs directly from your Power BI data model at report runtime and applies them to create filtered PDFs. So, you don't need to review and modify your filter values each time you run a BI Helper job. You can literally set up your report schedule and forget about it, while your reports run on time, every time!
See our tutorial Generate PDFs from Power BI with Dynamic Slicer and Filter Values | BI Helper for detailed instructions.
Use Cases for Automated Filtering
Automated filtering isn’t just a feature - it’s a solution to many common pain points. Here are a few scenarios where this functionality delivers great value:
- Customized Reporting: Different teams require different data. Marketing may need regional trends, while Sales focuses on individual client metrics. Automated filtering ensures each team gets what they need without duplicating efforts. For example, regional managers can receive performance metrics specific to their location, while executives receive a consolidated overview.
- Compliance and Governance: Automatically generate reports filtered by compliance criteria to ensure regulatory needs are met. This is particularly useful in industries like finance or healthcare, where regulatory requirements dictate how data is presented.
- Performance Dashboards: Deliver daily, weekly, or monthly dashboards tailored to each user’s role, providing them with actionable insights. Real-time dashboards can help team leads monitor KPIs without waiting for end-of-month summaries.
- Streamlined Presentations: Walk into meetings with reports tailored to your audience. So that the meeting stays focused on KPIs and performance, while all the work of gathering, analyzing, and presenting the underlying data has already been completed by Helper.
Eliminate the repetitive manual work of gathering and compiling data, and focus instead on analyzing it to drive impactful decisions.
How Does This Benefit Me and My Team?
The benefits of automated filtering extend beyond saving time. Here’s how it makes an impact:
- Enhanced Productivity: Automating repetitive tasks can help your team focus on more strategic initiatives. Tasks like data sorting, filtering, and report formatting are handled automatically. Teams can redirect their efforts toward strategic planning and analysis.
- Improved Accuracy: Automated filters eliminate human errors that often creep into manual processes. Consistent, error-free reports improve trust in data-driven decisions.
- Scalability: As your organization grows, managing report distribution becomes increasingly complex. Automated filtering scales effortlessly with your needs. Whether you’re generating 10 reports or 1,000, the process remains seamless.
- Personalized Insights: Stakeholders receive exactly the data they need, enhancing decision-making and boosting satisfaction. Personalized reports ensure that teams focus on relevant insights rather than sifting through large volumes of data.
How Can This Benefit My Company?
At an organizational level, the impact of automated filtering is deep and lasting. It fosters a culture of data-driven decision-making by ensuring that everyone has access to relevant, accurate, and timely information. By reducing manual effort and errors, it also contributes to cost savings and operational efficiency.
Businesses leveraging automation report higher employee satisfaction, as they can focus on meaningful work instead of tedious tasks. This translates into better outcomes for the company and its clients. Other benefits include:
- Faster Decision-Making: Timely reports empower leaders to act quickly on emerging trends.
- Resource Optimization: Automation reduces the need for manual report preparation, saving time and effort.
- Consistency Across Teams: Standardized reports ensure all departments operate with uniform data.
- Increased ROI: The time saved through automation can be reinvested into high-value activities.
Maximize the Value of Automated Filtering
- Start with Clear Objectives: Before setting up automation, identify the specific questions your reports need to answer. What insights are stakeholders looking for? How will they drive better decisions?
- Leverage Templates: Use pre-built templates to reduce setup time and maintain consistency.
- Engage Stakeholders: Collaborate with report recipients to ensure the automation meets their needs. Regular feedback can help refine the reporting automation.
- Monitor and Adjust: Periodically review the automated reports to ensure they remain relevant and accurate. Business needs evolve, and your reporting must stay in step.
Ready to Get Started?
If you’re a BI Helper user, it’s time to explore the full potential of automated filtering. Our guide on Slicer and Filter Setup can help you set up your first automated workflow in just a few steps.
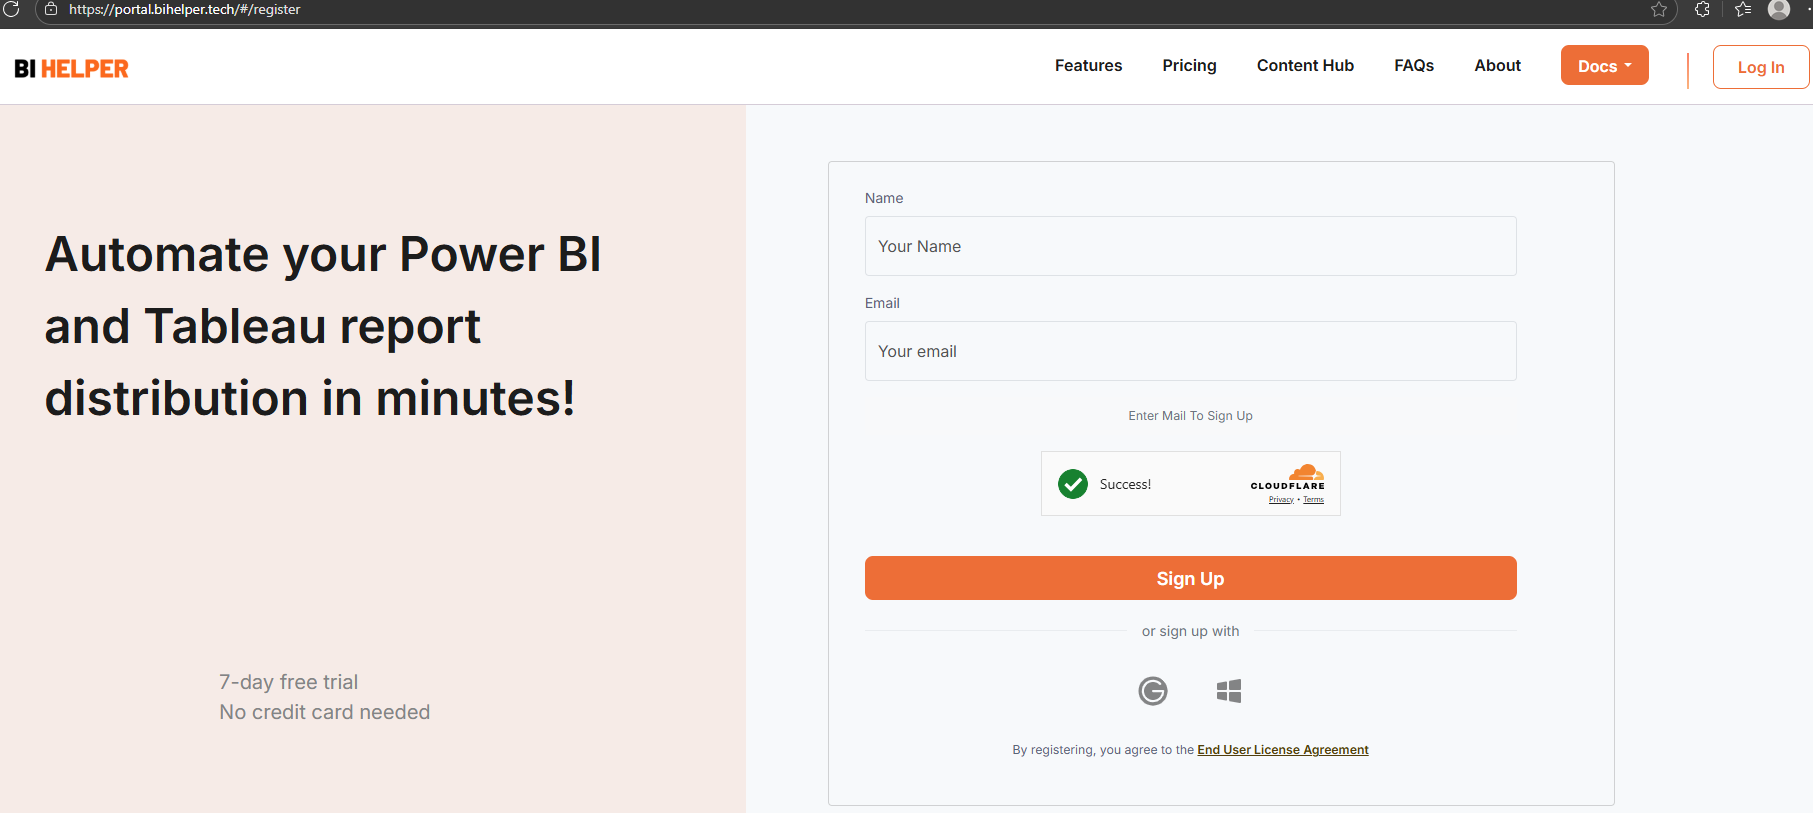
Not using BI Helper yet? Don’t miss out on the opportunity to transform your reporting process. Sign up for a free trial today and see the difference.